HTC with PanSolidification
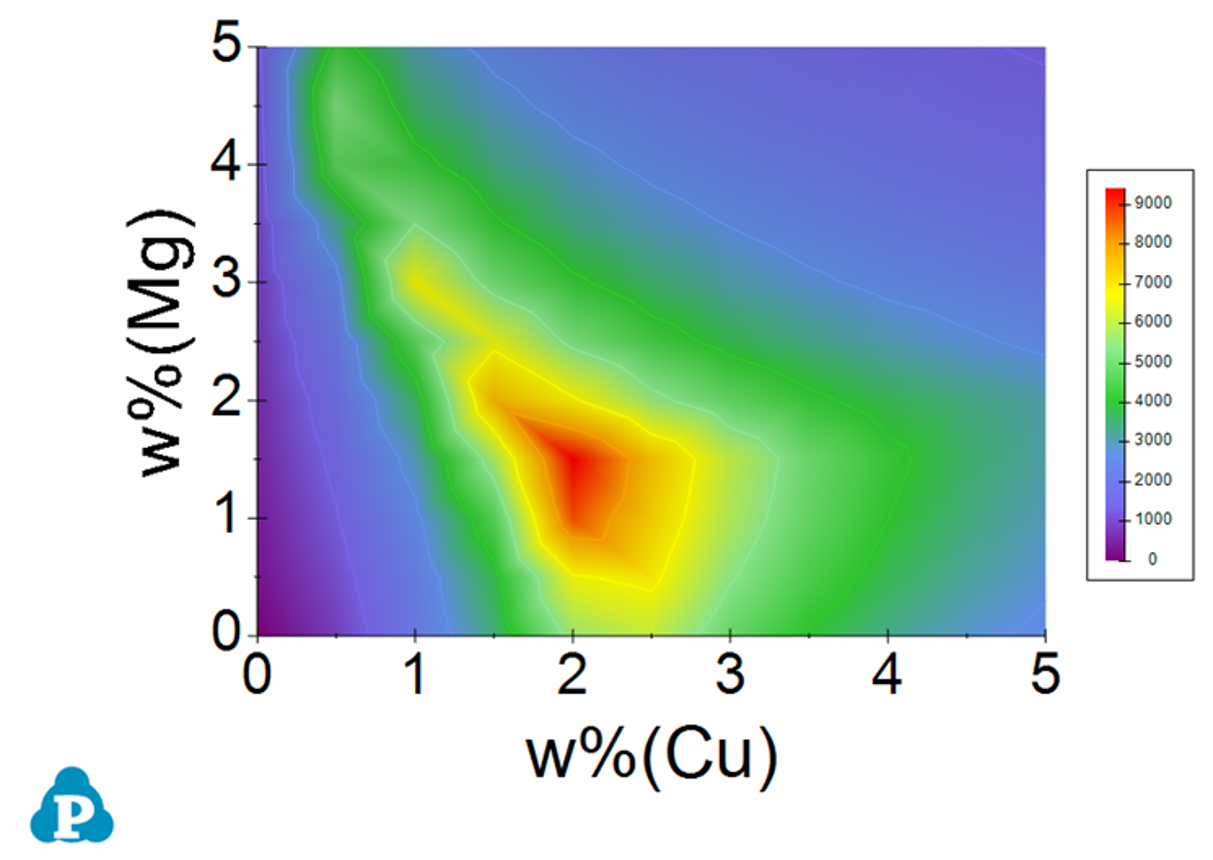
Hot tearing or hot cracking is a serious defect occurred in welding and casting solidification. Cracking usually generated at the end stage of solidification along grain boundaries. Prof. Kou [2015Kou] proposed a criterion to describe the crack susceptibility by using a simple crack susceptibility index (CSI), which is the maximum value of |dT/d(fs)1/2| at fs1/2 < 0.99. The CSI criterion has been successfully applied to several Al-based alloy systems. In this example, we will demonstrate how to use HTC function in PanSolidification module to produce a susceptibility map in the Al-Cu-Mg ternary system.
-
Create a workspace and select PanSolidification module. Save the workspace in a user assigned folder different from that of the default workspace. The HTC calculation results will be saved automatically under this folder.
-
Load proper thermodynamic + mobility database and select Al, Cu, Mg three components.
-
Load proper solidification kinetic-parameter database (.sdb) to select the solidification alloy system.
-
Choose the HTC function from the Batch Calc → High Throughput Calculation (HTC).
-
Choose the calculation type from the drop-down list of HTC pop-up window and select “pan_solidification”.
-
Define the compositional space for HTC simulation. As shown in Figure 2, the compositions of both Cu and Mg vary from 0 to 5wt% in a double composition loops.
-
Define the solidification conditions for HTC simulation. User can define the cooling rate (the example is 20 K/s) by using the “Thermal History” dialog in Figure 2 or select the “Load C. Curve” and click the “Import CC” button to browse and load the predefined cooling curves (.txt or .dat). The example format of cooling curve file can be found in Figure 1 in Section HTC in Console Mode. Users can also simply output the Thermal History from GUI by click the icon
 , then use the output file as a template to revise the cooling curve. Besides the cooling rate, the solidification rate or temperature gradient is also needed to be defined.
 -
In addition to use the default output, user can also customize the outputs using the “Extra Outputs” function. In this example, we defined the following extra output: time; T – temperature; w(*) – alloy composition; fs – solid phase fraction; sqrt(fs) – the square root value of the solid phase fraction; and CSI – the CSI index |dT/d(fs)1/2|. (Note: The CSI index is introduced in Pandat™ 2022 version. For earlier versions, users can use the expression of -T//sqrt(fs) to obtain the CSI values.)
-
After setup the compositional space for HTC and define the proper thermal history, user can click “Run HTC” button to perform HTC simulations.
-
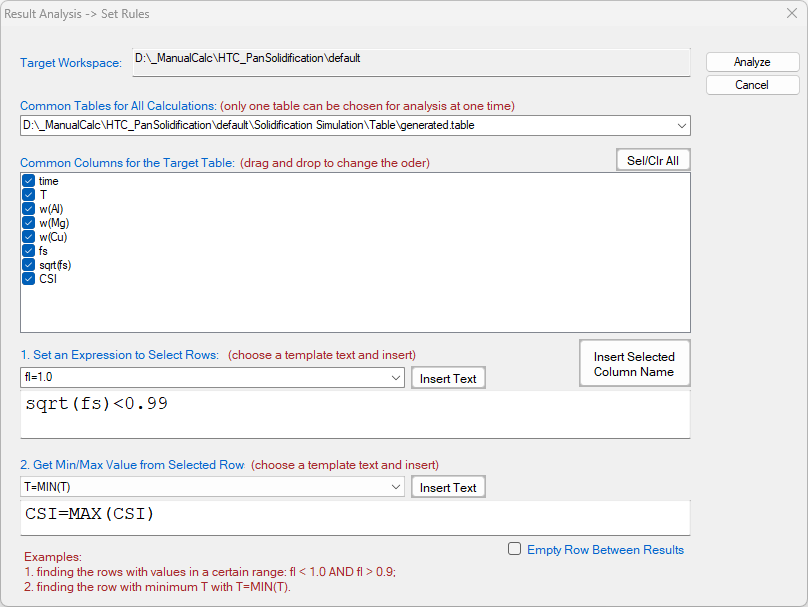
Run “Result Analysis” from the “Batch Calc” menu. User can use this commend to analyze the calculated results for a group of alloys and pick a certain property from each calculation for comparison. As shown in the following Figure 4, the criterion is to output the CSI=MAX(CSI) point with the condition of sqrt(fs) < 0.99 at each composition point.
-
Figure 5 shows the obtained crack susceptibility map for Al-Cu-Mg alloys with cooling rate of 20 K/s. User can run “Result Analysis” on this save workspace and dig out more information using other rules.

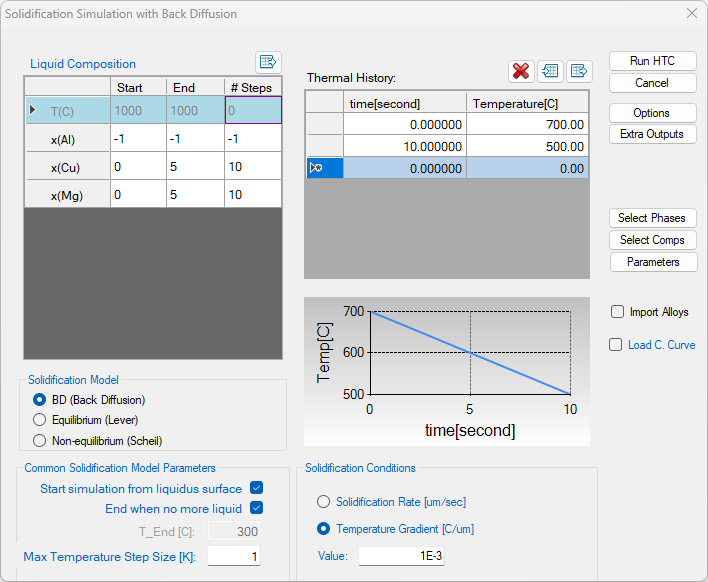
Figure 2: Dialog to setup compositional space and solidification conditions for PanSolidification HTC

[2015Kou] S. Kou, A criterion for cracking during solidification, Acta Mater., 88 (2015) 366-374.